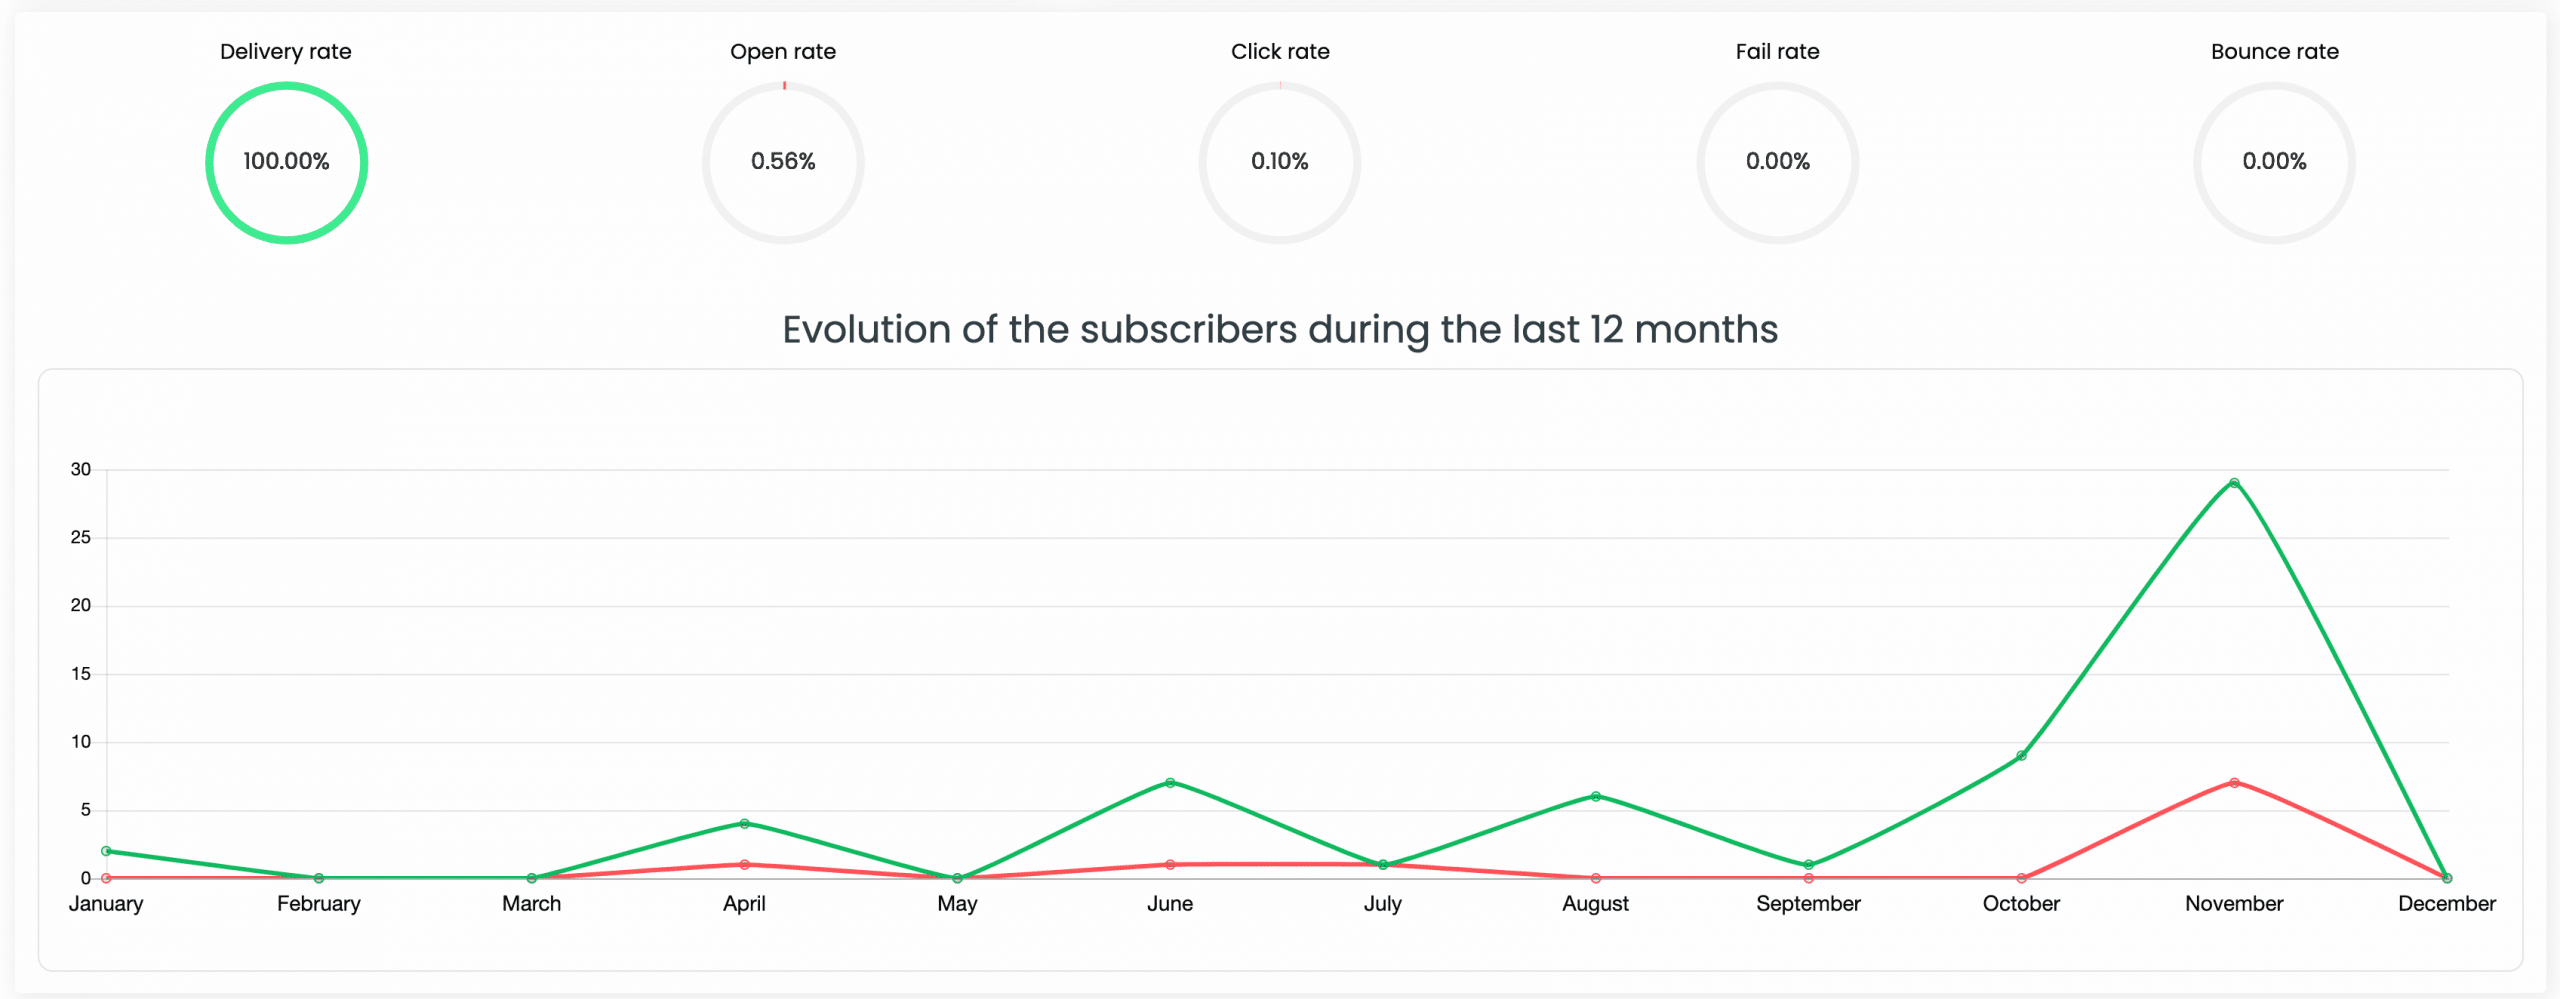
If you need to analyse the impact of your emails, this new feature is made for you. AcyMailing's new feature allows you to have more information about your campaigns and subscribers using more accurate graphs and statistics.
What's new?
The new features are mainly in the "Statistics" section of your plugin. Thanks to this feature, you can access the details of your campaigns more easily. Thus, this new feature allows you to :
- Statistics in your lists
A list is a group of subscribers to whom you will be able to send emails. Lists make it easier for you to manage your mass mailings or targeted actions. From now on, you can see the evolution of the new subscribers and unsubscribes in the past 30 days.
If you want to edit a list, you have access to a graph showing the number of subscribers and unsubscribes over the last 12 months. List edition includes several parts: basic information, subscribers, welcome and unsubscribe emails and list statistics. This allows you to get more details about the effectiveness of your campaigns. For example, you can create personalized emails when one user subscribes to a list and when another user unsubscribes to another.

- Have more detailed statistics
You now have access to more details about your mailings. You can know the device (Mac, iPad, Window...), browser or mail client (Gmail, Outlook...) used. This information is useful to know for which source you need to adapt the appearance of your emails.

If you want to send a massive email campaign, some detailed informations are now available in the overview statistic like:
- Successfully sent
- Open rate
- Click rate
- Bounce rate
- Unsubscribe rate
Thanks to these data, you can understand the strength and the weakness of your campaign and that will let you understand the impact of emails. For the record, here is what are the average statistics should be like:
- Open rate: between 15 and 25%
- Click through rate: about 2,5%
- Click-to-open rate: between 20% and 30%
In addition, a new chart cumulates the week openings. You can see the opening from Monday to Sunday. Depending on the results, you can select the good day or hour to send your campaign.

- Know your newsletters statistics and users
Many information are now available. For example, to know the statistics of each user, you have to go to the « User click detail ». It allows you to see click details by clicking on the newsletter link. It is only visible when an email is selected. On the other hand, if you want to know the details of newsletter clicks, you have all these information in the section « Links details ».
Here is a simulation of an email sending with the statistics:
I am raw html block.
Click edit button to change this html
What are the advantages of the statistic feature?
Overall, this feature makes your campaigns more effective. Indeed, the statistics and data collection on emails allows you to create campaigns with more and more impact thanks to the analysis of graphs and statistics. The results of these campaigns are an invaluable source of data for a brand who wants to capture the attention of its audience and prospects. Therefore, the target audience can be reached.
It's time to analyse the impact of your campaigns 😉
Every month new features are released. Last week the WordPress email personalization was put online : https://www.acymailing.com/followup-newsletter/
Interested in purchasing AcyMailing? Check our pricing page


